Values Associates integrates data visualization into all its no-code software. With data visualization, auditing, internal control, and compliance become accessible and understandable to everyone. The result: secure decisions and a high-performing organization.
With dataviz, give meaning and color to your data instead of locking it away in cells. Present it dynamically and interactively using our library of customizable templates. Stop processing it in a tool separate from the rest of your business activities.
Today, data is everywhere. It informs decisions. It guides choices. However, it must be understandable and actionable. Coming from the world of Business Intelligence, Values Associates knows how data processing and visual presentation are key to the performance of companies, local authorities, and administrations. This is why all our no-code software integrates data visualization. At a glance, interactive and dynamic formatting gives meaning and value to your data and provides you with the keys to take action.
With data visualization:
Technically, our solution is composed of a simple and intuitive no-code foundation, accessible and configurable by everyone, without IT development.
In addition to our data visualization library, our software offers:
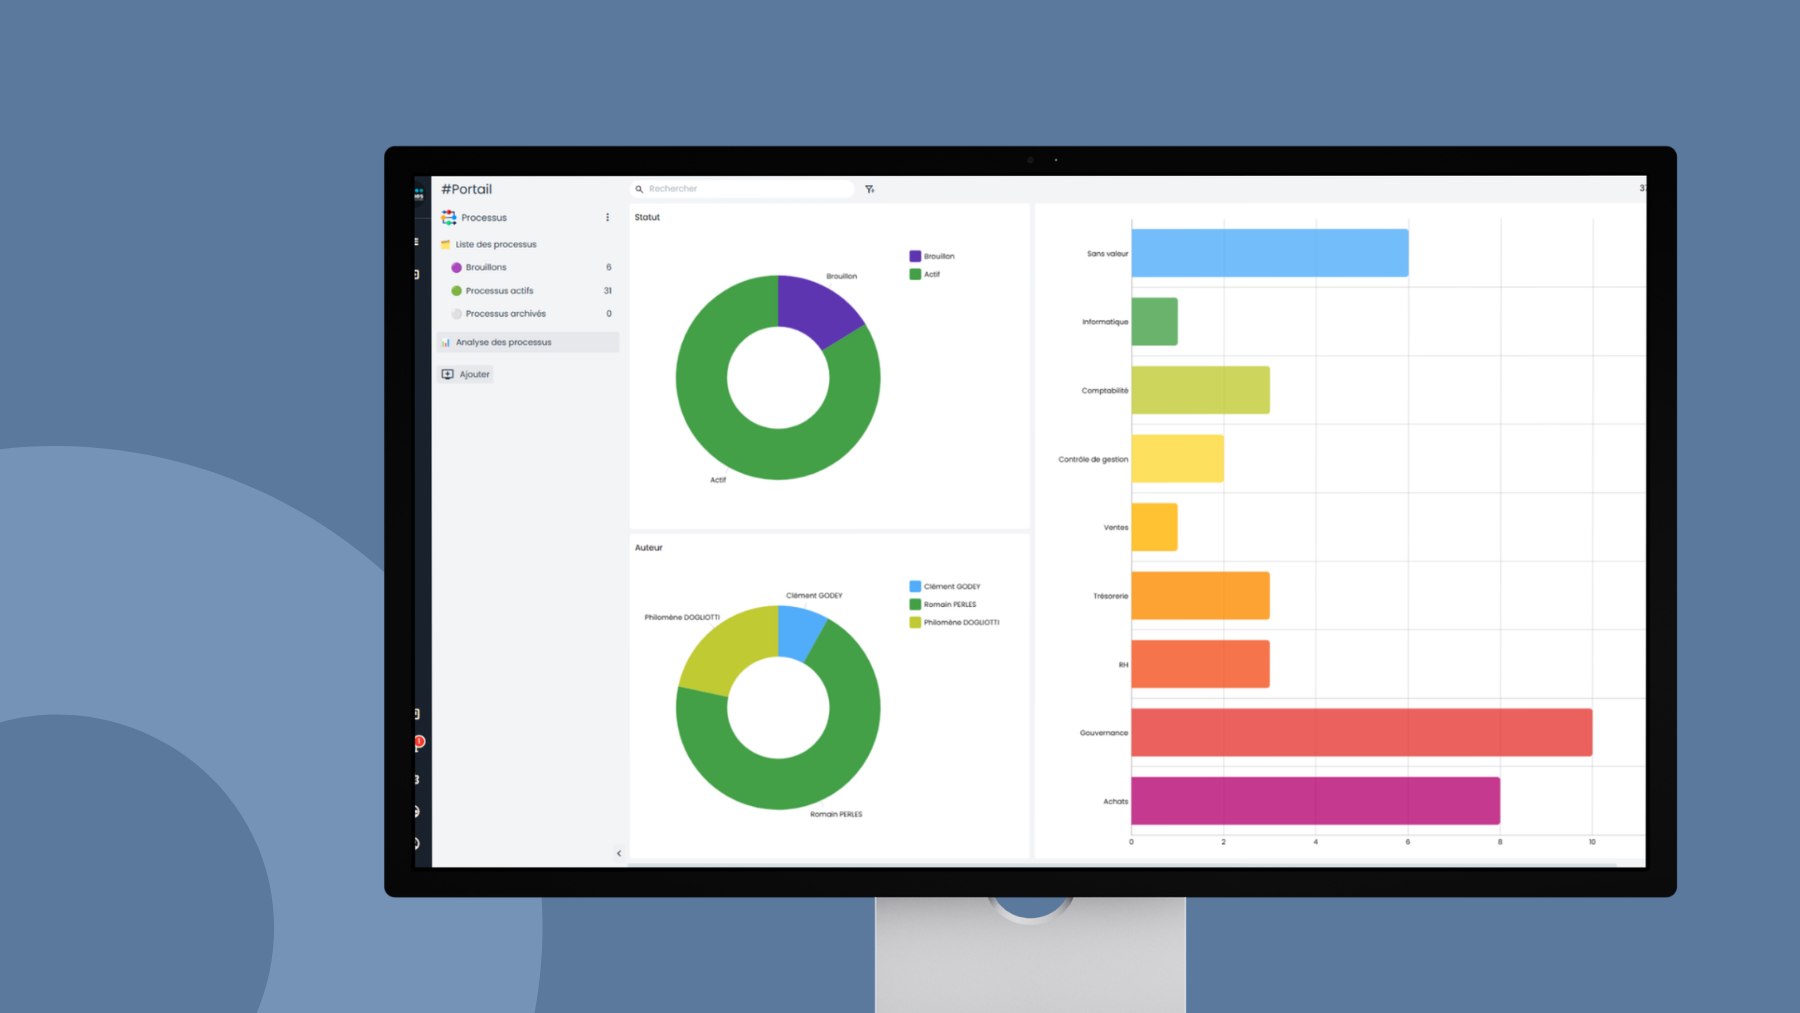
With our no-code software, create customized data visualizations independently, according to your challenges, your context, and the recipients of your communication
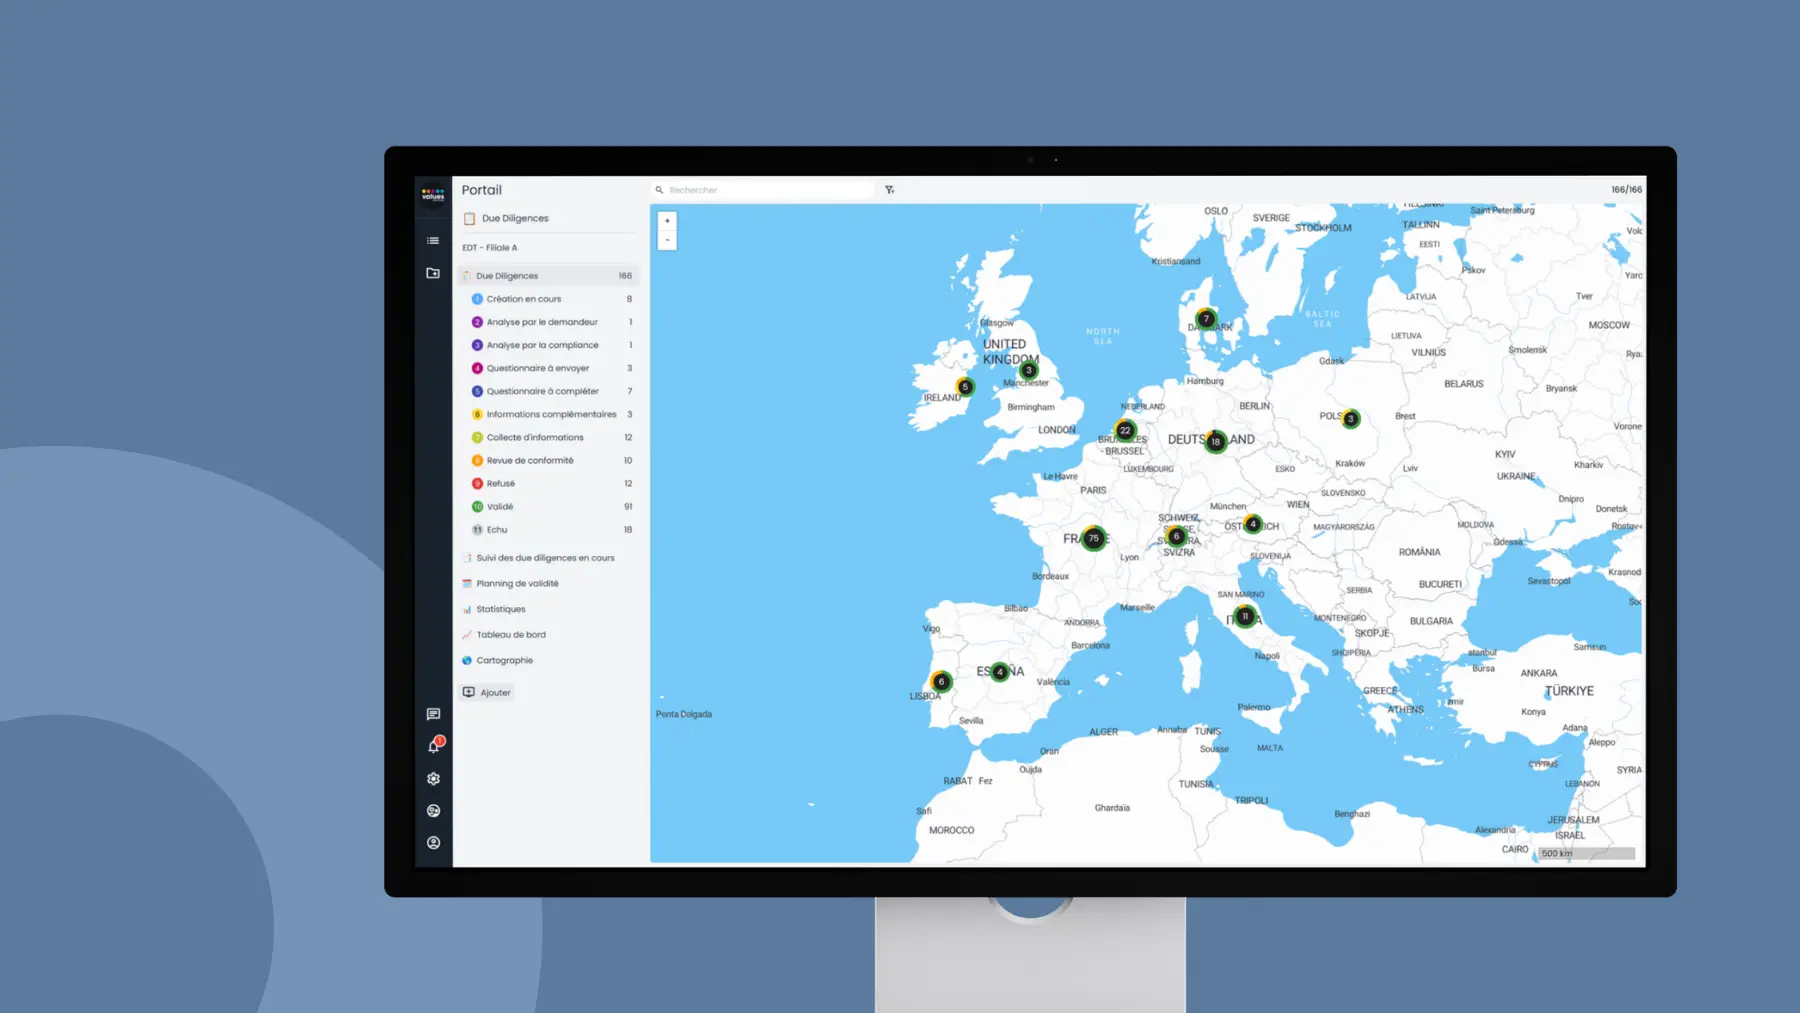
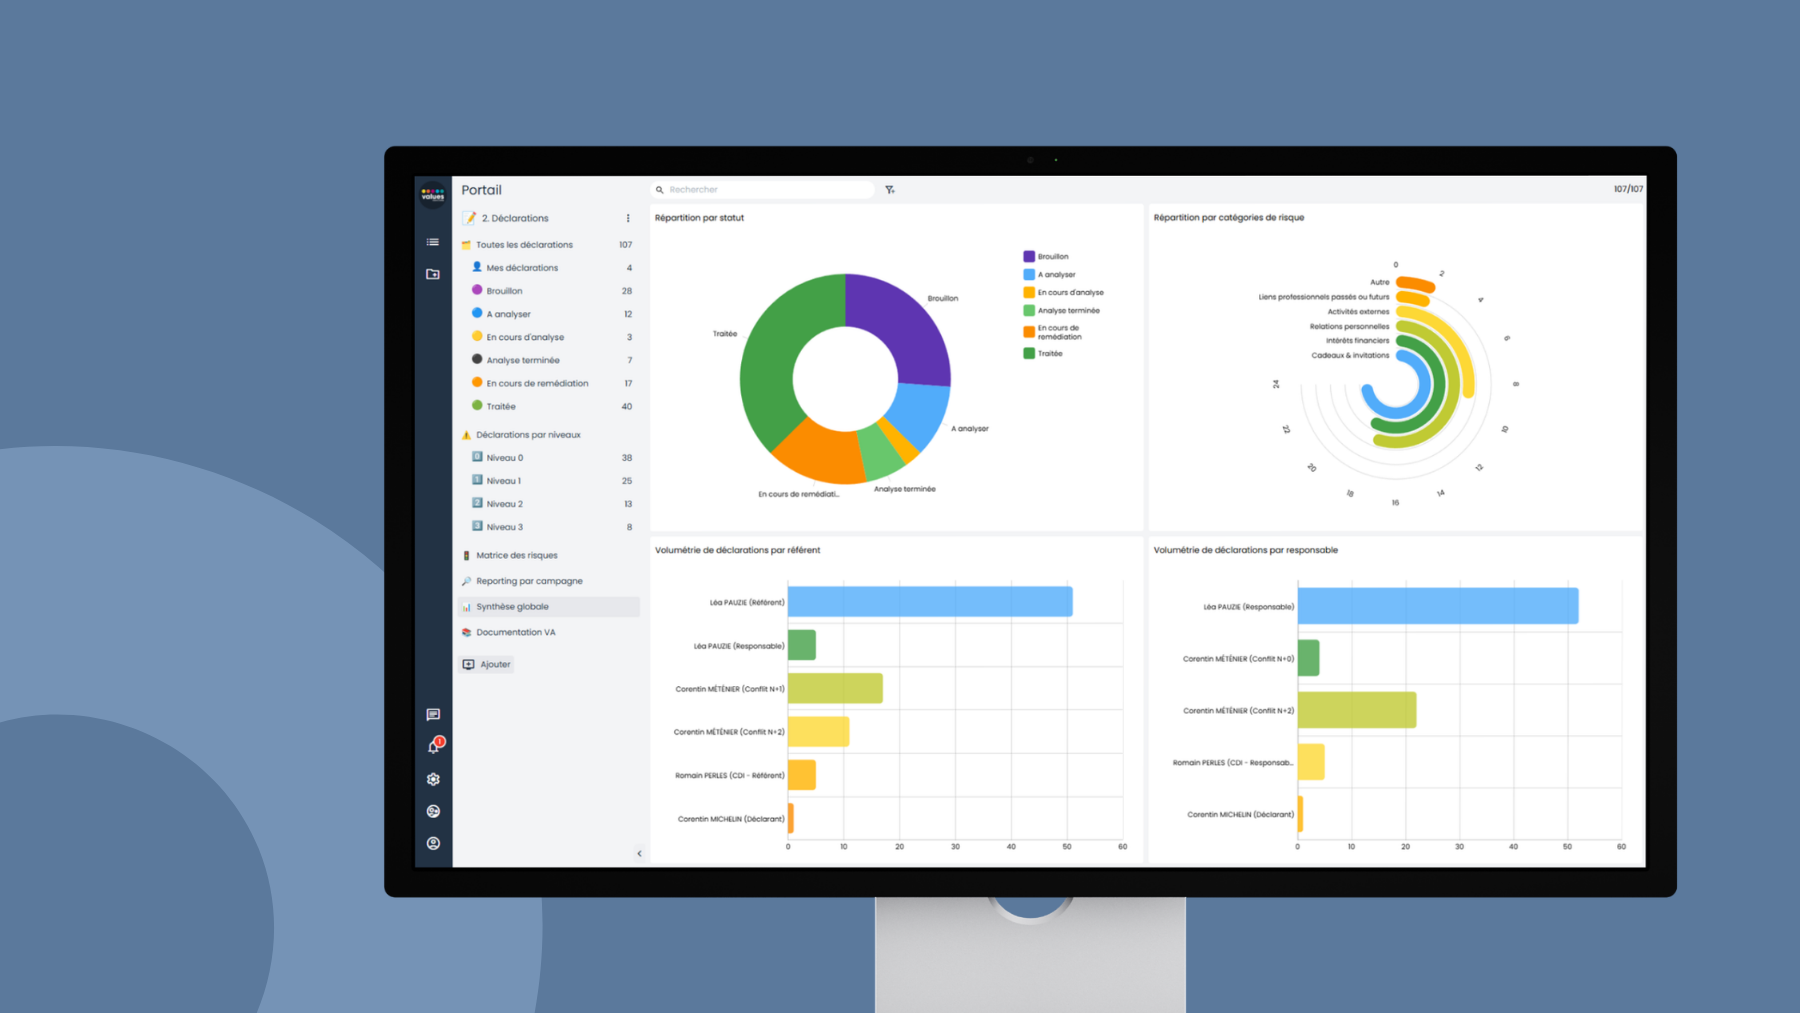
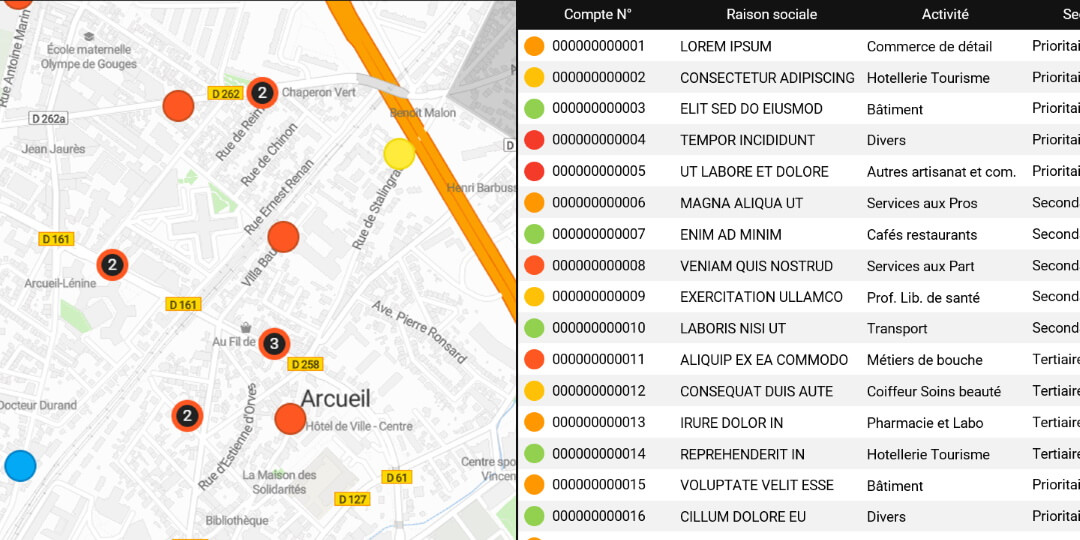
Data visualization is particularly suitable for communicating your risk mapping. It allows you to present results in a customized way, based on your own criteria. You can display all of your organization’s risks or target the entity with the highest criticality, a strategic axis, or a public policy.
Do you want to consolidate different risk mappings carried out at several levels? Our risk mapping software allows you to identify trends through configurable and customized visualizations, similar to data analysis tools like Power BI.