An innovative risk mapping software enabling you to visualize, identify, and assess risks within your organization, facilitating their proactive management and adapting mitigation strategies to your specific needs.
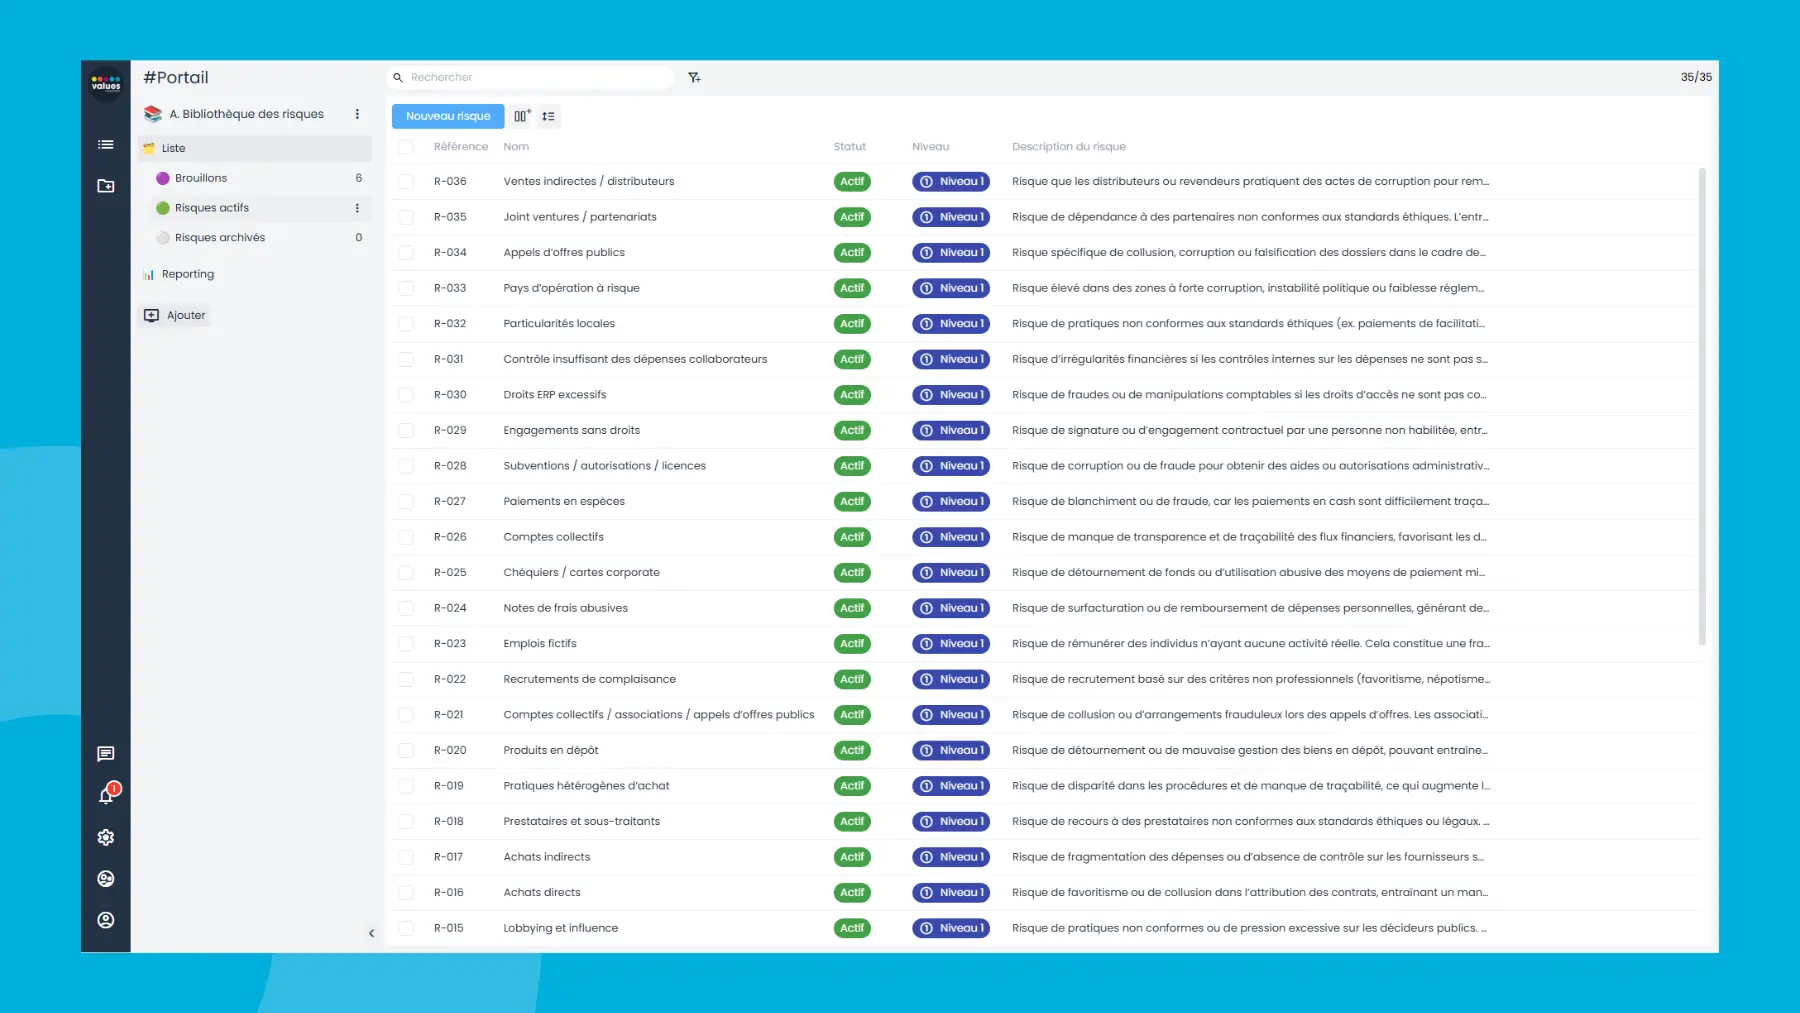
Transpose your risk frameworks and document all identified risks within your organization by providing detailed descriptions according to their nature and scope to facilitate the assessment of each of your risks (gross, net).
Ensure regular communication with all stakeholders through indicators and reporting covering the different stages of your system and enabling you to anticipate, assess, and manage the risks your organization may face.
Develop and implement specific controls and action plans. Controls can be created from a risk or directly from a control library.
List different control points within a control to indicate the steps to be performed. Action plans can be created during risk assessment, control execution, or directly from the action plan module.
From your organization's risk register, the risk control measures register, the risk matrix, and the audit trail of assessment changes made for a risk.
L’application permet l’activation de notifications spécifiques pour chaque utilisateur lors des changements de statut, comme pour la réalisation d’une action, et offre la configuration de plusieurs niveaux de validation des risques, avec des approbations possibles par un supérieur hiérarchique ou un groupe désigné.
Les workflows sont ajustés en fonction des décisions des valideurs, assurant un processus dynamique et réactif, tout en permettant un paramétrage des catégories de collaborateurs avec des seuils de tolérance et des workflows distincts adaptés.
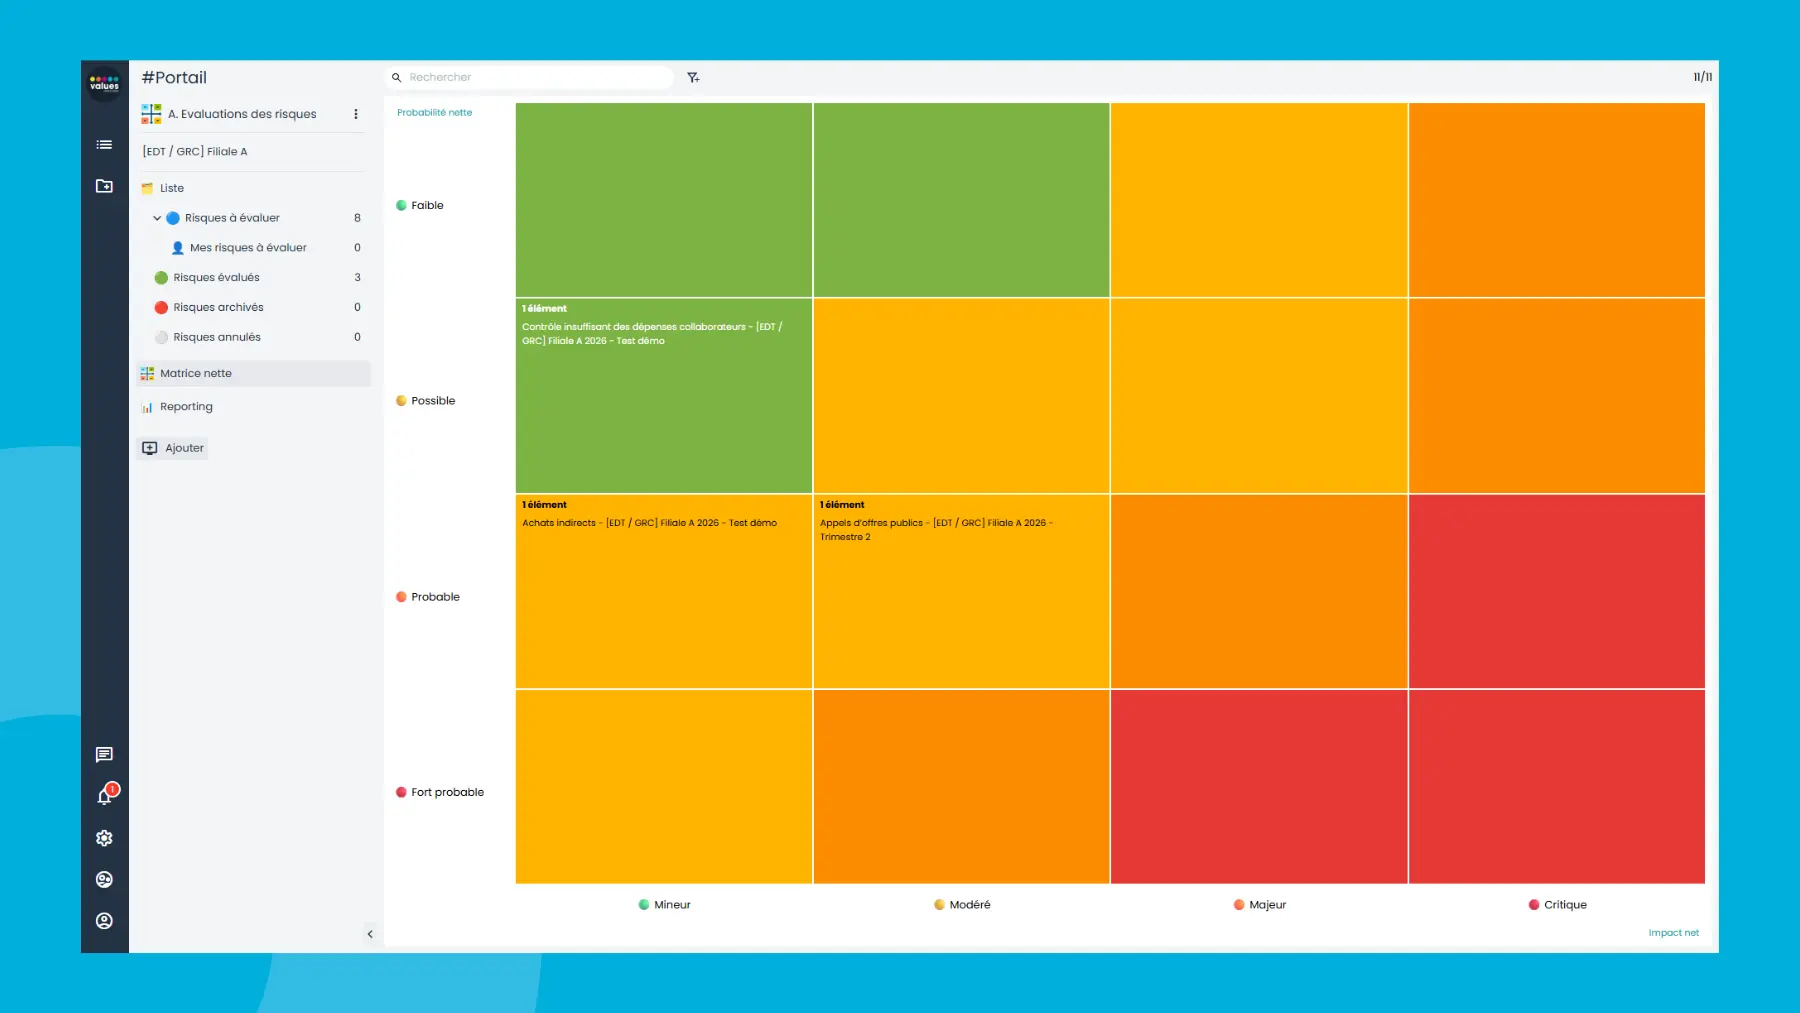
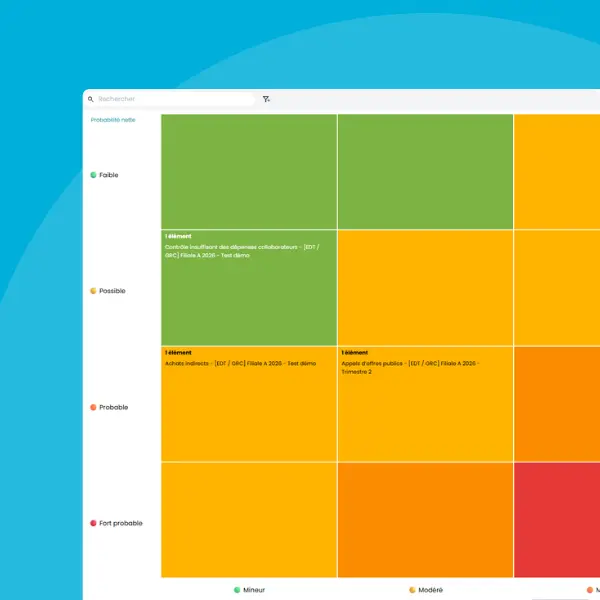
Une visualisation des risques sous forme de matrice pouvant être personnalisée selon vos besoins métiers.
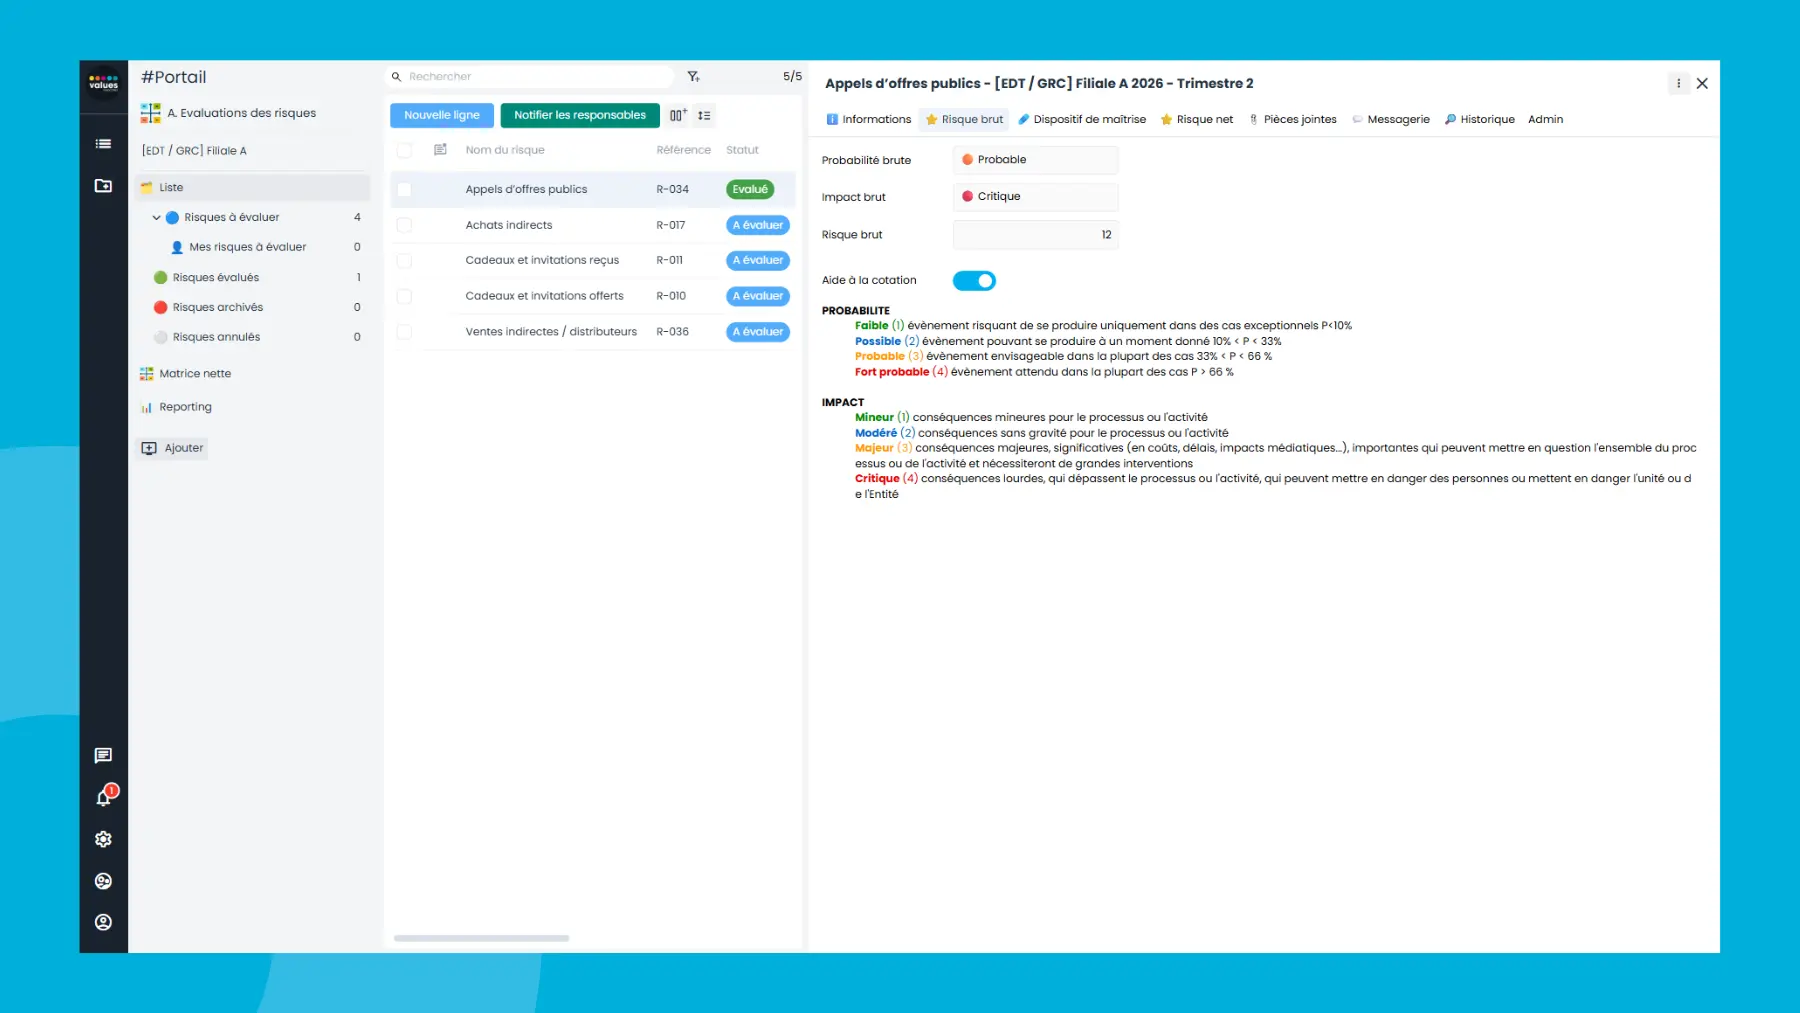
Le paramétrage des modalités d’évaluation du risque brut et du risque net permettent d’intégrer des scoring allant des plus simples aux plus sophistiqués.
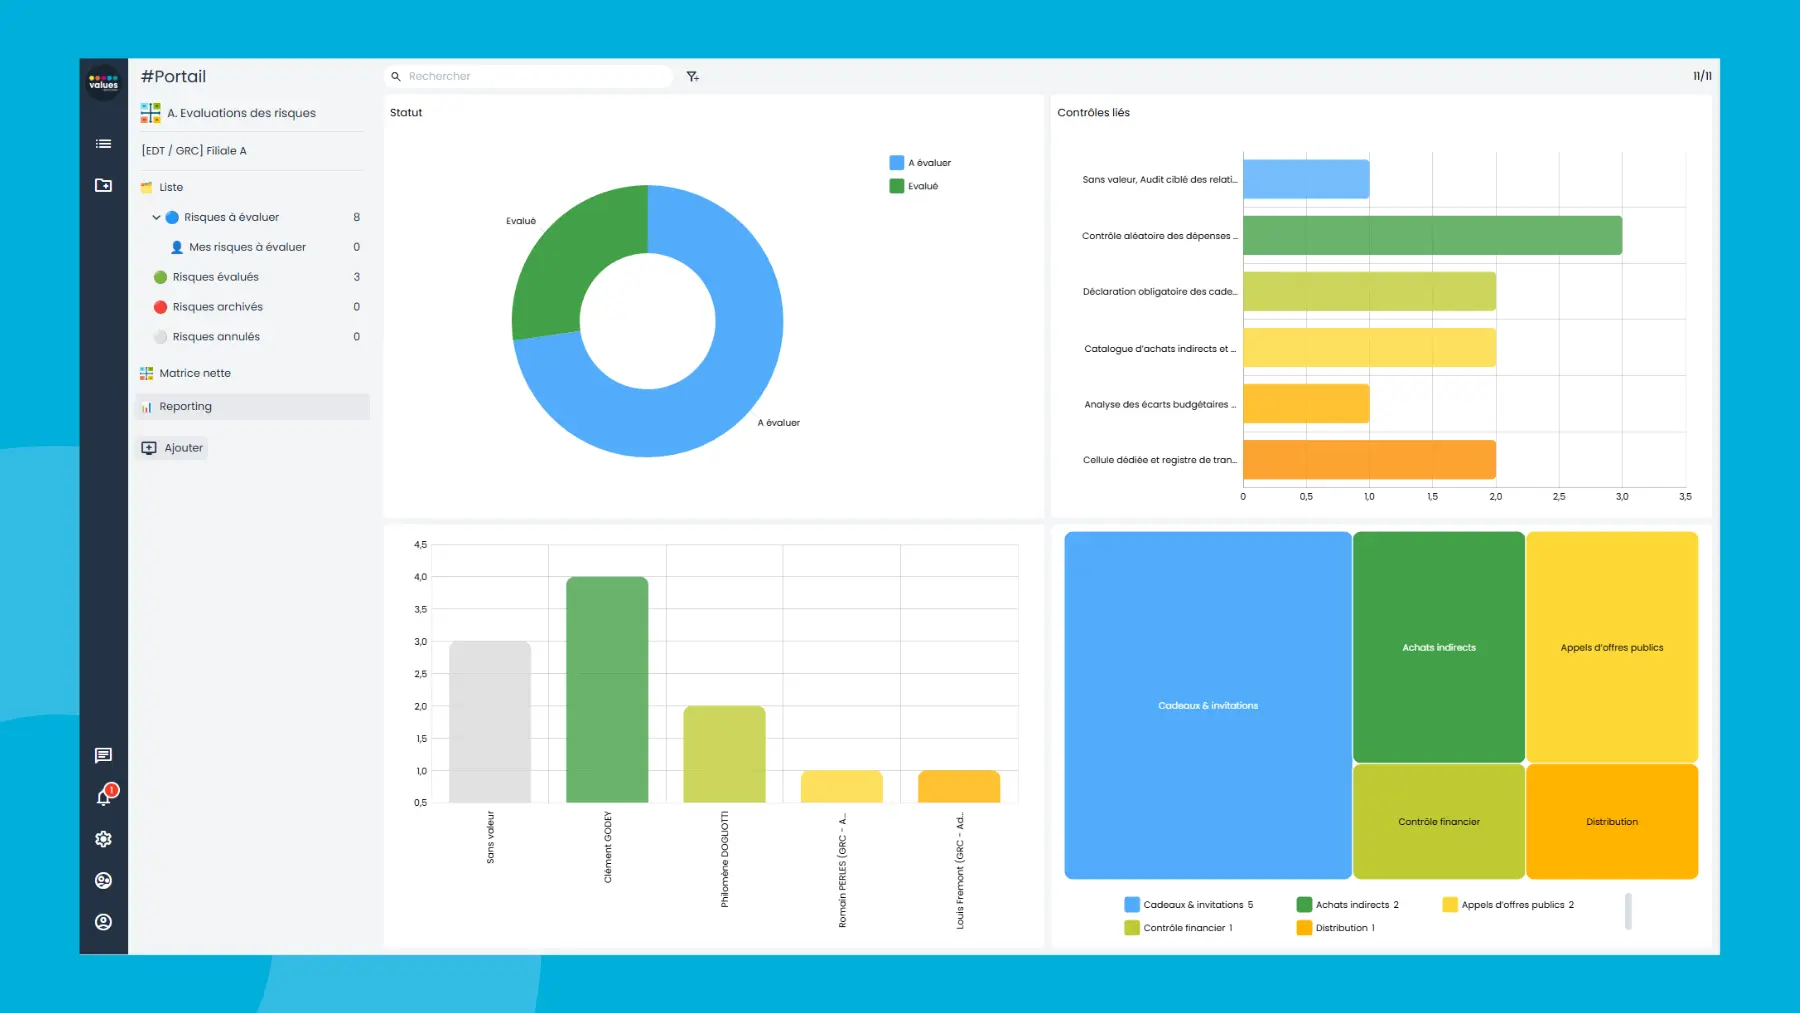
Un reporting en temps réel suit l’évolution des évaluations de risques, affiche un tableau de bord des évaluations et répartit les risques par zone géographique.
"Une excellente coordination pour atteindre nos objectifs"
"It is a real pleasure to work with you"
"The team stands out for its great responsiveness"
"Responsive and flexible"
"The flexibility of their solution and the quality of their support"
"Values Associates was able to provide a response tailored to our needs"
"Extremely satisfied"
Risk mapping enables the identification, assessment, and classification of risks to which an organization, company, or public entity is exposed.
On this basis, it guides, structures, and manages the associated action plans, providing a clear and prioritized view of potential threats.
Risk mapping encompasses all stages, from identification to the graphical representation of potential risks.
This process includes analysis of the probability of occurrence and the impact of risks, with distinctions between gross and net risks, based on control elements in place or to be established.
This initial assessment facilitates the prioritization of risks according to their criticality.
Risk mapping enables an in-depth understanding of the risks impacting an organization.
It promotes exchanges between stakeholders on the nature, causes, consequences, and interactions of risks.
This adjustment process optimizes resource allocation and the relevance of risk management measures.
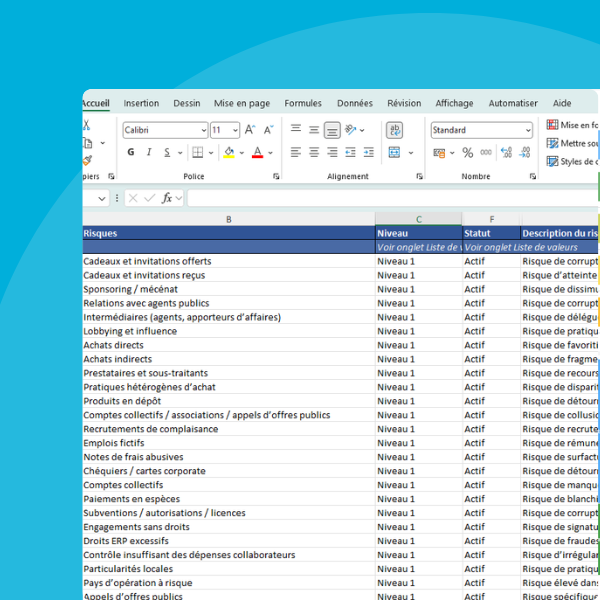
Excel is often one of the preferred choices for building a risk map. Numerous risk mapping templates, including free ones, are available on the internet. Its flexibility allows extensive adaptation to the specificities of each organization, thus facilitating data collection and structuring. It is easy to create risk matrices by organizing the collected data.
However, the use of Excel quickly reaches its limits in the context of risk mapping.
Integrating sources from numerous contributors constitutes a time-consuming and tedious activity.
Excel does not manage reminders nor does it promote collaborative work. Furthermore, maintaining a risk map designed in Excel can quickly become laborious: any modification often involves substantial adjustments due to the complexity of developments, particularly macro formulas.
Bien qu’Excel soit souvent utilisé pour construire des cartographies des risques grâce à sa flexibilité, il présente des limites significatives.
L’intégration de nombreuses sources de données peut devenir chronophage et fastidieuse.
Excel ne favorise pas le travail collaboratif et la maintenance des cartographies peut être laborieuse.
Notre logiciel de cartographie des risques reprend tous les avantages d’Excel tout en palliant ses inconvénients.
Ses principaux avantages incluent :
The development of a risk map generally follows four main stages.
It all begins with the identification of risks to which the organization is exposed. These risks are then assessed, particularly in terms of impact and probability, then classified according to their criticality for the organization. This data enables the definition of the associated risk management plan and the prioritization of actions.
The final stage consists of keeping the elements of the risk map up to date and readjusting them to account for changes likely to affect the organization.
Corruption risk mapping software is a tool designed to help organizations identify, assess, and manage corruption risks to which they may be exposed. It enables the visualization of these risks in the form of maps or matrices, thus facilitating understanding of their distribution and criticality within the organization.
Unlike a global or major risk map, corruption risk mapping has the specific purpose of identifying, analyzing, prioritizing, and managing the organization’s corruption risks in the normal course of its activities, particularly according to the sectors of activity and geographical areas in which it operates.
The AFA emphasizes that corruption risk mapping must be both comprehensive, formalized, and built according to a documented methodology, structured (for example by business or by process), scalable, and updated.
The use of Excel to develop a risk map is common, largely due to its flexibility and widespread adoption within organizations. However, Excel is not ideal for collaborative work and is poorly suited to processing multiple data sources. Updating a risk map created with Excel can become laborious and time-consuming.
The main elements include the identification of risk areas (related, for example, to each of the organization’s processes or to its relationships with third parties), the assessment of the probability and impact of identified risks, and the implementation of measures or controls to mitigate these risks. Factors such as the frequency of interactions, the amount of transactions, and relationships with public officials are particularly scrutinized.
Specific risk mapping software overcomes the limitations of Excel, particularly when it comes to integrating multiple contributors. Dedicated software significantly reduces time-consuming tasks, for example through automation of notifications and reminders or through expanded reporting capabilities. It centralizes all elements of your risk map in a single database. It offers an optimized user experience and facilitates buy-in from different contributors and stakeholders.